
Housing sales in India’s eight prime residential markets have shown an improvement during the April-June period of 2022, in spite of an increase in lending rates during the quarter, shows a report by leading real estate company PropTiger.com.
According to the report, titled Real Insight- April-June 2022, home sales saw 5% quarter-on-quarter increase in the three month period during which the RBI hiked the repo rate to bring it to 4.9% from 4%. The report by the Gurgaon-headquartered company shows that 74,329 units were sold in Q2 2022, as compared to 70,623 units sold in Q1 2022.
The increase in supply numbers was even more prominent during Q2 CY2022 – as against 79,532 units, a total of 1,02,129 units were launched in April-June of 2022, showcasing 28% quarter-on-quarter growth. This is indicative of an upbeat mood among the developer community due to a consistent positive buyer sentiment. Mumbai contributed the most to new supply, with a 42% share in the overall new launches in Q2 2022.
The markets covered in the report include Ahmedabad, Bangalore, Chennai, Hyderabad, Kolkata, Mumbai Metropolitan Region, Delhi-National Capital Region, and Pune.
Prices rise across cities
Apart from sales and launches, property values have also appreciated in the past one year, with all cities covered in the analysis showcasing a yearly price increase in the range of 5% to 9%.
| City-wise price break-up | ||
| City | Rate in Rs per sq ft | YoY growth in % |
| Ahmedabad | 3,500-3,700 | 8% |
| Bangalore | 5,700-5,900 | 7% |
| Chennai | 5,700-5,900 | 9% |
| Delhi NCR | 4,600-4,800 | 6% |
| Hyderabad | 6,100-6,300 | 7% |
| Kolkata | 4,400-4,600 | 5% |
| Mumbai | 9,900-10,100 | 6% |
| Pune | 5,400-5,600 | 9% |
| India | 6,600-6,800 | 7% |
*Weighted average prices as per new supply and inventory
Source: Real Insight Residential – April-June 2022, PropTiger Research
Inventory overhang at 34 months
Real estate developers are likely to take 34 months to sell off an unsold stock consisting of 763,650 units, the report shows. The decline in inventory overhang – in Q1, it stood at 42 months – is the outcome of sustained demand. Kolkata has the lowest inventory overhang of 24 months, whereas Delhi-NCR continues to have the highest inventory overhang of 65 months.
Of the available stock in the eight cities, nearly 25% of the unsold units fall in the ready-to-move-in category.
| Unsold stock | ||
| City | Number of units as of June 2022 | Inventory overhang in months |
| Ahmedabad | 64,860 | 33 |
| Bangalore | 70,530 | 26 |
| Chennai | 32,670 | 27 |
| Delhi NCR | 99,850 | 65 |
| Hyderabad | 82,220 | 37 |
| Kolkata | 22,640 | 24 |
| Mumbai | 271,890 | 38 |
| Pune | 117,990 | 25 |
| India | 763,650 | 34 |
Source: Real Insight Residential – April-June 2022, PropTiger Research
Previous reports:
Residential real estate growth momentum continues in Q1 2022: PropTiger.com report
Home sales and new launch numbers have shown a year-on-year growth in the period between January and March, 2022, according to PropTiger.com’s Real Insight Residential report
March 31, 2022:
- Residential prices firm up across top eight cities, Chennai witnesses maximum increase.
- Delhi NCR has the highest inventory overhang while Bengaluru and Kolkata have the lowest.
- 79% sales in Q1 reported in under-construction segment.
- Mumbai and Pune had the biggest share in housing sales, with their combined share standing at 56% in the overall sales across the top eight cities.
Activity in India’s residential real estate segment has seen a further increase in the first three months of the year 2022, as record low home loan interest rates fuel consumer enthusiasm, along with government-sponsored subsidy programmes.
According to a report by online real estate major PropTiger.com, which is part of REA India that also owns Housing.com and Makaan.com, home sales and new launch numbers have shown a year-on-year (YoY) growth in the period between January and March, 2022.
The report by the Gurgaon-headquartered company shows that 70,623 units were sold in Q1 2022, as compared to 66,176 units sold in Q1 2021, registering 7% YoY growth. The improvement in terms of new supply was significantly higher, with a YoY growth of 50% in new launches during the same period. A total of 79,532 units were launched in Q1 2022 as compared to 53,037 units in Q1 2021.
The markets covered in the quarterly report, titled Real Insight Residential – January-March 2022, include Ahmedabad, Bangalore, Chennai, Hyderabad, Kolkata, Mumbai Metropolitan Region, Delhi-National Capital Region and Pune.
“India’s housing sector is again emerging as a bright spot in the country’s economy, helping it spring out of the pandemic-induced slowdown. With further normalisation of activity in the months to follow, we expect greater positive changes,” said Dhruv Agarwala, group CEO, PropTiger.com, Housing.com and Makaan.com
79% sales in Q1 reported in under-construction segment
| Sales | |||
| City | Q1 2022 | Q1 2021 | YoY change % |
| Ahmedabad | 5,549 | 4,687 | 18% |
| Bangalore | 7,671 | 7,431 | 3% |
| Chennai | 3,299 | 4,468 | -26% |
| Delhi NCR | 5,013 | 6,188 | -19% |
| Hyderabad | 6,556 | 7,721 | -15% |
| Kolkata | 2,860 | 3,382 | -15% |
| Mumbai | 23,361 | 18,574 | 26% |
| Pune | 16,314 | 13,725 | 19% |
| India | 70,623 | 66,176 | 7% |
Source: Real Insight (Residential) January—March 2022
In a quarter during which the demand for housing units priced in the range of Rs 45 lakhs to Rs 75 lakhs was the highest, Mumbai and Pune had the biggest share in housing sales, with their combined share standing at 56% of the overall sales.
Even though the recent joint consumer survey conducted by the group company of REA India, Housing.com and industry body NAREDCO, found that 57% of potential homebuyers would prefer to buy a ready-to-move-in (RTMI) property, 79% of the sales during the quarter ended in March was seen in the under-construction category, mainly because of the price advantage that this segment offers over the ready-to-move-in segment.
See also: Impact of Coronavirus on Indian real estate
Half the cities show decline in launches
The MMR market did the heavy lifting in terms of new supply in the quarter ended March 31, demonstrating a 246% increase YoY. The stellar performance by this market was mainly responsible for an overall good performance of the housing market on this parameter, as four of the eight markets covered in the analysis showed a decrease in new launches. Cities where new launches showed a decline during the March quarter include Ahmedabad, Chennai, Delhi-NCR and Kolkata.
| New supply | |||
| City | Q1 2022 | Q1 2021 | YoY change % |
| Ahmedabad | 5,055 | 9,064 | -44% |
| Bangalore | 7,068 | 5,518 | 28% |
| Chennai | 1,629 | 5,556 | -71% |
| Delhi NCR | 4,270 | 4,778 | -11% |
| Hyderabad | 14,572 | 7,604 | 92% |
| Kolkata | 994 | 1,999 | -50% |
| Mumbai | 30,360 | 8,770 | 246% |
| Pune | 15,584 | 9,748 | 60% |
| India | 79,532 | 53,037 | 50% |
Source: Real Insight (Residential) January—March 2022
Property prices climb too
As expected, housing price growth also accelerated during the quarter, with every market covered in the analysis showing an upwards movement in average rates of new properties. Most of this increase in rates can be attributed to the hike in prices of building materials.
The sharpest uptick in property prices was registered in Chennai, where average rate of properties has undergone a 9% appreciation in the past one year, the report shows. Pune and Ahmedabad followed this southern market closely in terms of price increase, with both markets witnessing an 8% rise in their average property rates.
| City-wise price card | ||
| City | Price range in Rs per sq ft as on March 2022* | YoY % growth |
| Ahmedabad | 3,500-3,700 | 8% |
| Bangalore | 5,600-5,800 | 6% |
| Chennai | 5,700-5,900 | 9% |
| Delhi NCR | 4,500-4,700 | 4% |
| Hyderabad | 6,000-6,200 | 7% |
| Kolkata | 4,300-4,500 | 5% |
| Mumbai | 9,800-10,000 | 4% |
| Pune | 5,400-5,600 | 8% |
| India | 6,600 – 6,700 | 7% |
Source: Real Insight Residential – January-March 2022, PropTiger Research
*Weighted average prices as per new supply and inventory
Agarwala is of the opinion that house ownership may become pricier with various government-funded subsidy schemes coming to an end in March 2022. This price appreciation would be further compounded by rising home loan rates, if the RBI were to hike the benchmark lending rate, which may well be on the cards, given inflationary pressures. So far, the country’s central bank has maintained the repo rate – to which home loan interest rates in India are linked – at 4%.
Housing inventory increases marginally amid higher supply numbers
As activity in housing supply picked up pace, housing inventory swelled slightly, at an annual rate of 4%. Builders in India are sitting on an unsold stock consisting of 7,35,852 units as on March 31, 2022. This number stood at 7,05,344 units at the end of March 2021. With an individual share of 35% and 16%, respectively, Mumbai and Pune continue to contribute the most to this national housing inventory.
However, inventory overhang – the estimated period builders are likely to take to sell off their unsold stock – has declined to 42 months as against 47 months a year ago, primarily because of higher demand for housing. Delhi NCR has the highest inventory overhang while Bangalore and Kolkata have the lowest.
| India’s unsold residential inventory | ||
| City | Unsold stock as on March 31, 2022 | Inventory overhang in months |
| Ahmedabad | 62,602 | 42 |
| Bangalore | 66,151 | 31 |
| Chennai | 34,059 | 34 |
| Delhi NCR | 1,01,404 | 73 |
| Hyderabad | 73,651 | 42 |
| Kolkata | 23,850 | 31 |
| Mumbai | 2,55,814 | 48 |
| Pune | 1,18,321 | 32 |
| India | 7,35,852 | 42 |
Source: Real Insight (Residential) – January-March 2022, PropTiger Research
Homes sales, new supply jump in 2021 on improved buyer sentiment: PropTiger report
Property prices accelerated in 2021 on the back of an upshot in prices of construction materials, the report points out.
February 17, 2022: Growth metrics show activity in India’s leading housing markets intensified towards the second half of 2021, after prolonged lull during which Asia’s third-largest economy was consistently battered by multiple waves of the coronavirus pandemic, shows the latest report by PropTiger.com, the country’s leading online real estate brokerage company.
According to the report titled Real Insight Residential – Annual Round-up 2021, home sales in India’s eight prime housing markets increased 13% in 2021, when compared to the overall sales in 2020. A much sharper growth was seen in terms of new supply in 2021 as against 2020—a total of 2.14 lakh units were launched in 2021 compared to 1.22 lakh units in the preceding year, showcasing an upward swing of 75%.
This improvement in key growth metrics for the sector, the second-largest employment generator in India after agriculture, could largely be attributed to support measures launched by the government in the aftermath of the coronavirus pandemic, improved consumer sentiment, stable prices and historically high housing affordability.
Mumbai, Pune steer sales upswing
Builders sold 2,05,936 housing units for the full year 2021 as against 1,82,639 units in 2020. This growth in sales was largely driven by India’s financial capital Mumbai, where a total of 58,556 homes were sold in 2021. Closely following the Maximum City was its neighbour Pune, where a 9% jump resulted in sale of 42,425 apartments last year, the report by the Gurgaon-headquartered real estate firm shows.
Flexible payment plans continue to keep homebuyers inclined towards under-construction homes, which made up for 80% of the home sales during the year, the report adds.
Buyer sentiment driving new launch wave
Amid a visible change of approach towards housing ownership among consumers in the aftermath of the pandemic, real estate developers in India stepped up efforts to offer better housing choices in 2021. As a result of this, barring Chennai where a marginal decline was seen, new supply showed a jump in all cities covered in the analysis during the year.
“Beyond the numbers which speak for themselves, what is remarkable is the resilience of the real estate market in India. Despite multiple waves of the pandemic, which resulted in multiple lockdowns, the residential real estate market has not only bounced back but is also on the cusp of a cyclical upturn. With policy support from the government and the low interest rate regime maintained by the RBI, I am very confident about the sector, entering into 2022,” said Dhruv Agarwala, Group CEO, Housing.com, Makaan.com & PropTiger.com.
“Developers have been quick to respond to the positive changes in buyer sentiment, as evidenced by the offers available in the market, especially during the festive season of 2021, which resulted in improved metrics for both, demand and supply. Basis the data available with us, it seems very likely that we will see an increase in prices in 2022, even as the inventory overhang continues to decline in 2022. The biggest trend we foresee is that the real estate market will continue to consolidate its growth in 2022 as well,” said Rajan Sood, Business Head, PropTiger.com.
Increase in raw material price pushed property prices up in 2021
Consistent increase in raw materials prices is pushing up property prices, with all eight prime residential markets covered in the report showing annual increase in per square foot price of new properties. Ahmedabad and Hyderabad housing markets were leading this pack, with an annual price hike of 7% each in 2021.
| City-wise price card | ||
| City | Weighted average price in Rs per square foot as on December 2021 | YoY % growth |
| Ahmedabad | 3,400-3,600 | 7% |
| Bangalore | 5,500-5,700 | 6% |
| Chennai | 5,400-5,600 | 5% |
| Delhi NCR | 4,400-4,600 | 5% |
| Hyderabad | 5,900-6,100 | 7% |
| Kolkata | 4,300-4,500 | 5% |
| Mumbai | 9,700-9,900 | 4% |
| Pune | 5,100-5,300 | 3% |
| India | 6,300 – 6,500 | 6% |
Source: Real Insight Residential – Annual Round-up 2021, PropTiger Research
Inventory overhang declines to 3.5 years
The improvement in sales in 2021 has been instrumental in lowering the inventory burden for India’s real estate developers. Consequently, inventory overhang — the estimated time builders would take to sell off the existing unsold stock, based on the current sales velocity— has now declined to 42 months. As on December 31, 2021, builders had an unsold stock consisting of 7,26,943 units in India’s eight housing markets. While the inventory overhang is the highest for the Delhi-NCR market at 68 months, it is the lowest for Kolkata, at 31 months.
| India’s inventory burden | ||
| City | Unsold stock on December 30, 2021 | Inventory overhang in months |
| Ahmedabad | 63,096 | 45 |
| Bangalore | 66,754 | 32 |
| Chennai | 35,729 | 33 |
| Delhi NCR | 1,02,147 | 68 |
| Hyderabad | 65,635 | 35 |
| Kolkata | 25,716 | 31 |
| Mumbai | 2,48,815 | 51 |
| Pune | 1,19,051 | 34 |
| India | 7,26,943 | 42 |
Source: Real Insight Residential – Annual Round-up 2021, PropTiger Research
Realty sector headed towards normalcy, as sales, supply show upward movement in Q3: PropTiger report
Sings of a more stable recovery for real estate are visible with a decline in inventory overhang, as well
Even as India’s economy witnesses a trend towards a return to normalcy, the country’s housing sector has also begun to show signs of stabilisation, marking an end of a prolonged period of uncertainty after the Coronavirus outbreak.
Home sales and new launches in India’s eight prime residential markets showed a manifold jump during the July-September period of 2021 in the aftermath of the second wave of the virus spread, amid the looming fears of a third wave of the COVID-19 pandemic, shows Real Insight (Residential) – July-September (Q3) 2021, a quarterly analysis of eight leading housing markets in the country.
“It is now a well-established fact that the notion of property ownership has gained significant currency in the aftermath of COVID and its impact on the way people live and work. Even as this has helped build positive consumer sentiment vis-à-vis residential real estate, support measures by the government and the banking sector have set the ball rolling for a positive change in momentum for the sector. In combination, these two factors have helped drive both, demand and supply, metrics upward during the July-September quarter of 2021,” says Dhruv Agarawala, group CEO, Housing.com, Makaan.com and PropTiger.com.
“The stage is now set for the festive season to give that much-desired fillip for the industry that it has been eagerly awaiting and working so hard for,” Agarwala adds.
Sales and launches show manifold jump
The report shows that a total of 55,907 new housing units were sold in the eight housing markets in Q3, a 59% increase year-on-year. On a quarterly basis, home sales showed much stronger growth of 250% – only 15,968 units were sold during the April-June period this year (Q2 2021).
Units in the price bracket of less-than-Rs-45-lakhs, contributed the highest to the quarterly sales, by claiming a 40% share, followed by the Rs 45-75 lakhs ticket-size, which took a 28% share.
New supply too, showed sharp upwards movement during the quarter after a prolonged period of decline. New launches in Q3 demonstrated a three-fold jump to 65,211 units when compared to Q3 2020, when a total of 19,865 units were launched. The sequential increase in the new supply was 199%.
Of the total units launched in Q3, 33% were from the Rs 45-75 lakhs price bracket, the highest number of launches seen in any segment during the quarter. Mumbai (33%) and Ahmedabad (21%) saw the highest number of quarterly launches.
Rajan Sood, business head, PropTiger.com said, “Considering housing affordability is at a record high this festive season on the back of 10-year-low home loan interest rates and sops offered by some state governments in the form of reduced stamp duties and circle rates, we expect housing markets in the top eight cities to show solid stability in the ongoing quarter. Though the overall cost of construction has gone up due to the rise in the cost of crucial input materials, rather than seeing an increase in prices, buyers are being offered discounts during the festive season.”
“States can support the recovery process further by either announcing newer incentives for home buyers or by extending or launching stamp duty and circle rate waivers,” Sood added.
Inventory overhang declines to 44 months
Signs of a more stable recovery in the real estate sector are also evidenced by the decline in inventory overhang, the estimated period developers would take to sell off the unsold stock. Inventory overhang in Q3 2021 fell to 44 months from 48 months in the previous quarter, even though builders in India had an unsold stock consisting of 7,20,519 units across the eight residential markets.
Unsold stock: City-wise break-up
| City | Unsold inventory as on September 30, 2021 | Inventory overhang in months |
| Ahmedabad | 51,208 | 42 |
| Bengaluru | 67,644 | 35 |
| Chennai | 35,145 | 32 |
| Delhi NCR | 1,00,559 | 62 |
| Hyderabad | 50,103 | 25 |
| Kolkata | 26,382 | 32 |
| Mumbai | 2,61,385 | 58 |
| Pune | 1,28,093 | 41 |
| Pan India | 7,20,519 | 44 |
Source: Real Insight (Residential) – July-September (Q3) 2021
Price growth remains muted across cities; Ahmedabad defies trend
While no decline was witnessed in the average rates of new apartments and villa-based projects across the markets covered in the analysis and prices did move upwards in the past one year, the increase in values was also largely marginal. Ahmedabad, where the upwards swing was most prominent, saw average values of properties going up by 8% in Q3 when compared to the same period last year.
Price growth: City-wise break-up
| City | Average price range as on September 30, 2021 (in Rs per sq ft)* | Annual growth in % |
| Ahmedabad | 3,300 – 3,500 | 8 |
| Bangalore | 5,400 – 5,600 | 4 |
| Chennai | 5,300 – 5,500 | 3 |
| Hyderabad | 5,800 – 6,000 | 6 |
| Kolkata | 4,100 – 4,300 | 2 |
| MMR | 9,600 – 9,800 | 3 |
| NCR | 4,300 – 4,500 | 5 |
| Pune | 5,000 -5,200 | 4 |
| National average | 6,200 – 6,400 | 5 |
Source: Real Insight (Residential) – July-September (Q3) 2021
*All prices are weighted average prices as per new supply and inventory.
Real estate activity seen picking up in June 2021, post COVID-19 second wave: PropTiger report
Although the second wave of the Coronavirus pandemic has derailed the stakeholders’ plans to speed up recovery in India’s real estate sector, activity seems to be picking up again towards the end of Q2 CY2021
July 6, 2021: If demand and supply indicators started to indicate a nascent recovery in India’s real estate sector during the first three months of 2021, these hopes have been marred during the following quarter, shows a recent report by leading property brokerage firm, PropTiger.com.
Home sales in India’ eight prime residential markets showed a quarterly increase of 12% in the January-March quarter (Q1) of 2021 (calendar year). However, with transactions being recorded only for 15,968 units across these eight markets during the second quarter, home sales during the three-month period ending June 30 declined 16% YoY while registering a 76% quarterly fall.
The economic uncertainty caused by the second wave of the Coronavirus pandemic, has also forced real estate developers in India to adopt a more cautious approach towards spending. This is reflected in the numbers for new supply of units in the April-June period (Q2) of 2021 (CY 2021), shows the report titled Real Insight (Residential) – April-June (Q2) 2021.
While demand and supply both remained adversely impacted during the first two months of the quarter, a period when most states remained in partial lockdowns to contain the virus spread, home sales and new launch numbers started to pick up in June, when states began the gradual opening-up process, the report by the Gurgaon-headquartered real estate advisory points out.
“As the black swan pandemic broadened its base in the form of a second wave in India, the second quarter was characterised by high infection rate, loss of life and city-wise lockdowns that pulled the reins of the recovering economic momentum that was witnessed in the first quarter of 2021,” the report noted.
“Due to the challenging situation during the April-June quarter in 2021, when infections and casualties caused by the Coronavirus hit a peak before subsiding towards the end of May, both, demand and supply, were hit during the first two months, when most states put in place various restrictions and lockdowns to curb the spread of the virus. However, some ground on both the numbers was covered during the month of June, when states started to open up. The same is reflected in Q2 demand and supply numbers. We expect improvement on both these indicators of residential real estate health in the upcoming quarters, since India’s vaccination programme is likely to gather pace. It is also important to mention that despite the lockdowns and subdued sentiment, the government gave the sector a much-needed boost with the passing of the Model Tenancy Act, which is expected to give a fillip to rental housing supply in the country. The RBI is also doing its bit by continuing to maintain its accommodative stance, keeping the repo rate and reverse repo rate at a status quo of 4% and 3.35%, respectively, which in turn would allow the low mortgage interest rate regime for home buyers, to continue. All these measures, combined with latent demand, will certainly help our sector to bounce back faster than what was anticipated earlier,” said Dhruv Agarwala, group CEO, Housing.com, Makaan.com and PropTiger.com.
New launches register 74% annual surge
In the three-month period that saw India record dramatically high numbers of infections and fatalities caused by the virus spread, supply of new apartments and flats in India’s eight prime residential markets in Q2CY21 witnessed a decline of 59% when compared to the January-March period of 2021. A total of 21,839 new units were launched in these markets during Q2CY21. However, when compared to the same period in 2020, new launches showed an increase of 74%.

This remarkable increase in launches in Q2 over the same period the previous year could be explained by the fact that during a large period of Q2 CY2020, India continued to keep in place a national lockdown, forcing Asia’s third-largest economy to slip into a recession in 2020. This forced liquidity-starved real estate builders in the country to tread highly cautiously during April-June 2020.
Affordable housing continues to be the key focus area of India’s real estate developer and this is evident from the fact that a majority of the new supply was concentrated in the mid-segment. In fact, 35% of the projects launched in Q2CY21 were in the Rs 45 lakhs to Rs 75 lakhs price bracket, shows the report.
Home sales decline 16% QoQ
Even though real estate has emerged as a popular asset class among consumers in the aftermath of the pandemic, housing sales in Q2 showed depreciation on both, sequential, as well as yearly basis. All cities saw sales declining quarter-on-quarter, while annual comparisons show some improvement for a few cities.
“The second wave of the pandemic has been an impediment to the recovery momentum, as the demand in the second quarter of 2021 has plummeted below the same period in 2020, which was characterised by a complete nationwide lockdown in the wake of the first round of the COVID-19 outbreak. Though, technically, the sector was more prepared to deal with the virus after a year, it was the severity of the second wave that dampened the consumer sentiment and arrested the recovery momentum,” the report pointed out.
“Unlike last year, there is a silver lining of the availability of much-awaited vaccines this time and while April and May 2021 saw diminutive sales, we see demand picking up pace in the month of June 2021, pointing towards a speedier rebound in the ensuing quarters, unlike what was seen after the first wave in the preceding year,” it added.
With the second wave of the pandemic posing questions about the certainty of incomes, home buyers put on hold their plans to invest in property, in spite of the fact home loan interest rates that are at a 15-year-low currently, make property acquisition a sensible proposition. According to the report, 45% of homes sold during the three month period were priced up to Rs 45 lakhs.
Inventory overhang rises due to impact on demand
Amid a marginal 1% annual increase, inventory stock in these residential markets reached 7,11,215. Inventory overhang – the average estimate time that builders will take to sell off the unsold stock at the current sales velocity – has also increased by one month when compared to the previous quarter. The report pegs the inventory overhang at 48 months now, as against 47 months in Q1. This means, builders will take an average 48 months to sell of the over 7.11 lakh unsold units, in view of the current sales velocity.
“While the impact of the second wave of the virus was universal, some markets were impacted more, as they were the hardest hit by the pandemic. This has been reflected in the high levels of unsold inventory and higher inventory overhang in markets like the NCR and MMR. This is especially true of the NCR market, where the inventory overhang was as high as the MMR, even though the unsold stock in that market was less than half of what is there in the MMR,” said Mani Rangarajan, group chief operating officer, Housing.com, Makaan.com and PropTiger.com.
While the MMR and the NCR markets have the highest inventory overhang of 64 months each, Hyderabad had the lowest inventory overhang of 27 months. However, it is Kolkata that has the lowest unsold stock. On the other hand, the western markets of Mumbai and Pune hold the highest share of unsold stock, claiming 54% share in the overall stock.
Unsold stock: City-wise break-up
| City | Unsold stock on June 30, 2021 (units) | Inventory overhang (in months) |
| Ahmedabad | 43,251 | 42 |
| Bangalore | 71,119 | 40 |
| Chennai | 37,478 | 42 |
| Hyderabad | 45,573 | 27 |
| Kolkata | 28,591 | 36 |
| MMR | 2,53,728 | 64 |
| NCR | 1,03,269 | 64 |
| Pune | 1,28,206 | 44 |
| National average | 7,11,215 | 48 |
Source: Real Insight: Q2 2021
Out of the available stock in the top eight cities, nearly 23% falls in the ready-to-move-in category, the report points out.
Barring some cities, price growth remains muted
No property covered in the analysis showed any great value depreciation during the quarter, while growth remained flat in the Mumbai Metropolitan Region (MMR), shows the report by the Elara Technologies-owned PropTiger.com. Recording an annual appreciation of 5% each in average rates of new supply, the Ahmedabad and Hyderabad property markets, however, stood out in this list. Values of property in India’s Silicon Valley Bengaluru also appreciated by 4% year-on-year, in Q2.
Price growth: City-wise break-up
| City | Average price as on June 30, 2021 (in Rs per sq ft) | Annual growth in % |
| Ahmedabad | 3,251 | 5 |
| Bangalore | 5,495 | 4 |
| Chennai | 5,308 | 3 |
| Hyderabad | 5,790 | 5 |
| Kolkata | 4,251 | 2 |
| MMR | 9,475 | No change |
| NCR | 4,337 | 2 |
| Pune | 5,083 | 3 |
| National average | 6,234 | 3 |
Source: Real Insight: Q2 2021
India’s housing market in April-June 2021: Key takeaways
- The top eight housing markets witnessed new supply to the tune of 21,840 units, a nearly 74% rise from the new supply recorded in the completely washed-out period of April-June 2020.
- Hyderabad remained the frontrunner, vis-à-vis new supply, contributing nearly 40% to the total numbers, followed by Bengaluru.
- A majority of the new supply across cities was concentrated in the mid-segment, with 35% of the projects launched being in the price bracket of Rs 45 lakhs to Rs 75 lakhs.
- Q2 CY2021 saw primary residential sales to the tune of 15,968 units only, registering a decline of 16% from the bottomed-out quarter of Q2 CY2020 and a whopping 76% decline from the preceding quarter.
- Sales in the sub-Rs 45 lakhs price segment saw the highest traction, with a 45% share.
- In Q2 CY2021, the share of ready-to move-in homes in total sales slightly reduced to 16%, as compared to 21% in Q1 CY2021.
- 2BHK remained the most preferred configuration for both, buyers and developers, in this quarter, with 46% share in the total launches and total sales.
- Mumbai and Pune held the highest share of unsold stock, together contributing 54% to the entire stock.
- Out of the available stock in the top eight cities, nearly 23% of the unsold inventory was in the ready-to-move-in category.
- Hyderabad had the lowest inventory overhang of 27 months.
Home sales increase by 12% in Jan-March quarter amid stamp duty, home loan rate cuts: PropTiger report
New supply shows 49% annual increase during the quarter amid a slight reduction in unsold stock.
April 9, 2021: Support measures announced by the government at the centre as well as by several state governments to provide an impetus to India’s real estate sector have started to show positive outcomes, with property sales in India’ eight prime residential markets showing a quarterly increase of 12% in the January-March quarter (Q1) of CY (calendar year).
Real estate developers sold a total of 66,176 homes in the primary market in the January-March quarter of 2021, shows Real Insight – Q1CY21, a quarterly recent report by online property brokerage firm PropTiger.com that analyses the most active housing markets in India, including Ahmedabad, Bengaluru, Chennai, Hyderabad, Kolkata, NCR, MMR and Pune.
“As the economy gradually marches towards recovery, as reflected in global rating agencies and think-tanks revising India’s growth forecasts for 2021 and 2022, the residential real estate market in the country is also seeing a positive momentum on the back of various measures taken by the centre and state governments, the RBI and the entire banking system (as demonstrated in home loan rate reductions). This positive change is visible in the first quarter through an increase in supply numbers, an indication that developers are more comfortable now with regard to liquidity support and buyer sentiment. Metrics on the demand side have also been largely stable, with the job market opening up again in various industries, giving people the confidence to take advantage of a property market that is at its most affordable for home buyers in years” said Dhruv Agarwala, group CEO, Housing.com, Makaan.com and PropTiger.com.
Stamp duty cuts, low lending rates fueled demand
The marginal jump in home sales during Q12021 coincides with several state governments, including Maharashtra and Delhi, announcing stamp duty and circle rate reductions to boost buyer sentiment and by effect housing sales.
“The Maharashtra government’s decision to temporarily lower stamp duty on property registrations helped mitigate the steep decline in sales for the Mumbai and Pune markets that contribute the most to the national stock of unsold homes. The state government should have continued with the benefit of reduced rates to keep the sales momentum going. We also expect states like UP and Haryana to announce stamp duty and circle rate reductions in order to provide support to crucial housing markets of Noida and Gurugram in the national capital region,” said Mani Rangarajan, Group COO, Housing.com, Makaan.com and Proptiger.com.
“In a show of great intent to help buyer sentiment, almost all banks have lowered home loan interest rates to 6.90% level. We expect this low rate regime to continue, as the Indian economy attempts to make a recovery from the pandemic-induced GDP contraction,” Rangarajan added.
When compared to Q1CY20, however, home sales in the markets covered in the analysis showed a decline of 5% from 69,555 units, something that can be termed marginal, considering that the January-March period in 2020 was the last quarter before the pandemic spread started in India, forcing the government to announce a nation-wide lockdown late in March 2020 that brought economic activity in the country to a standstill.
City-wise break up of sales numbers in Q1 2021
| Sales | 2020 | 2021 |
QoQ % Growth
|
YoY % Growth
|
||
| City | Qtr. 1 | Qtr. 4 | Qtr. 1 | |||
| Ahmedabad | 4,511 | 3,125 | 4,687 | 50% | 4% | |
| Bangalore | 8,197 | 7,660 | 7,431 | -3% | -9% | |
| NCR | 5,411 | 6,065 | 6,188 | 2% | 14% | |
| Chennai | 3,643 | 3,180 | 4,468 | 41% | 23% | |
| Hyderabad | 5,554 | 6,487 | 7,721 | 19% | 39% | |
| Kolkata | 2,747 | 2,518 | 3,382 | 34% | 23% | |
| Mumbai | 23,969 | 18,331 | 18,574 | 1% | -23% | |
| Pune | 15,523 | 11,548 | 13,725 | 19% | -12% | |
| Total | 69,555 | 58,914 | 66,176 | 12% | -5% | |
Source: Real Insight: Q1 2021
“Though the recent surge in coronavirus infections concentrated in a few markets is a concern, we expect the residential market recovery to continue,” said Agarwala.
Launches show 49% annual increase
A total of 53,037 units were launched across the eight markets during the three-month period, which saw the Union Cabinet approving a Bill to set up a Rs 20,000-crore Development Finance Institution to offer long-term capital support for infrastructure development in India. This marked an annual growth of 49% in housing supply. A quarter-on-quarter (QoQ) comparison shows new launches declined slightly by 2% when compared to the last quarter of CY20.
Price growth remains stable
No extraordinary upwards movement was seen in average values of property in the primary segment. While annual growth remained largely flat in most markets, Ahmedabad and Hyderabad showed some firming up of property values, with both cities registering 5% annual growth in average rates of property.
Annual price growth: City-wise break-up
| City | Average price as on March 31, 2021 (in Rs per square foot) | Annual growth in % |
| Ahmedabad | 3,234 | 5 |
| Bangalore | 5,450 | 3 |
| Chennai | 5,275 | 3 |
| Hyderabad | 5,713 | 5 |
| Kolkata | 4,208 | 1 |
| MMR | 9,474 | No change |
| NCR | 4,327 | 1 |
| Pune | 5,076 | 3 |
| National average | 6,234 | 3 |
Source: Real Insight: Q1 2021
Inventory declines but overhang increases
After undergoing a 5% decline, unsold inventory in the eight markets stood at 705,344 as on March 31, 2021. The western markets of MMR and Pune contribute the most to this unsold stock, with a combined share of 54%.
Also, despite the various government measures launched to support growth, demand has yet to reach the pre-Covid-19 level. This is reflected in the fact that inventory overhang—the estimated time builder would take to sell off the existing stock keeping in view the current sales velocity— has remained unchanged at 47 months as it was in the previous quarter.
Unsold stock: City-wise break-up
| City | Unsold stock on March 31, 2021 | Inventory overhang |
| Ahmedabad | 42,991 | 42 |
| Bangalore | 69,285 | 37 |
| Chennai | 37,697 | 40 |
| Hyderabad | 39,191 | 25 |
| Kolkata | 28,827 | 36 |
| MMR | 254,183 | 62 |
| NCR | 105,279 | 68 |
| Pune | 127,891 | 41 |
| National average | 705,344 | 47 |
Source: Real Insight: Q1 2021
While Kolkata has the least number of unsold units, Hyderabad has the lowest inventory overhang.
Home sales, new supply improve in Q4 2020 amid festive season: PropTiger report
In the backdrop of a mild improvement in various economic indicators, new supply and sales in India’s eight prime residential markets showed an improvement in Q4 2020 over Q3 2020
January 11, 2021: The much-anticipated festive season that covers the period between October and December (Q4) has brought some relief to India’s housing market that has been reeling under the impact of the Coronavirus pandemic, according to a PropTiger.com report, ‘Real Insight: Residential Annual Roundup 2020’. The report, which analysed the performance of India’s eight prime residential markets during the last three months of 2020, showed that both, new supply and homes sales, registered a quarter-on-quarter (QoQ) improvement in the quarter ending December 31, 2020.
Yearly round-up of India’s top 8 residential markets in 2020
| City | Launches YTD | Sales YTD | Unsold Inventory as on December 31, 2020 | Inventory overhang as on December 31, 2020 (in months) |
| Ahmedabad | 7,687 | 12,156 | 38,614 | 38 |
| Bengaluru | 17,793 | 23,458 | 71,198 | 36 |
| NCR | 12,094 | 17,789 | 1,06,689 | 72 |
| Chennai | 12,382 | 10,452 | 36,609 | 42 |
| Hyderabad | 22,940 | 16,400 | 39,308 | 29 |
| Kolkata | 3,288 | 9,061 | 30,210 | 40 |
| Mumbai | 20,899 | 54,237 | 2,63,987 | 58 |
| Pune | 25,343 | 39,086 | 1,31,868 | 40 |
| Total | 1,22,426 | 1,82,639 | 7,18,483 | 47 |
Source: Real Insight: Residential Annual Roundup 2020
New launches show quarterly, as well as annual improvement
With the launch of a total of 54,329 new units across the eight markets covered in the analysis, Q4 2020 witnessed a 173% Q0Q growth in new supply. The numbers also reflect a year-on-year (YoY) increase of 12%, when compared to the data for the corresponding period in 2019.
A city-wise break-up of launches also shows that in Q4 2020, there has been a quarterly increase in launches across markets, barring Ahmedabad. The highest number of units were launched in Hyderabad, Pune and Mumbai.
The affordable housing segment, i.e., housing units priced up to Rs 45 lakhs, continues to dominate the market, contributing 54% to the overall new supply, followed by the mid-segment with a 25% share.
In the entire 12-month period of 2020, however, a total of 1,22,426 were launched. This is half the new supply that filled the market in 2019 (2,44,256 units). Note here that new supply had been adversely affected, because of a multi-year slowdown in India’s housing markets, much before the Coronavirus pandemic aggravated the difficulties for the sector.
“The quarterly spike in supply numbers, could largely be attributed to the increased popularity of residential realty in the aftermath of the Coronavirus pandemic, which has laid bare the insecurities of other asset classes. Various government-offered support measures to provide a cushion to the developer community, have also provided some scope to launch new schemes,” the report says.
Hyderabad was the only city among the top eight cities that witnessed a positive YoY growth of 11% in 2020.
Click here to read the full report
Break-up of sales and launches in 8 cities in Q4 2020
| City | Launches | Sales |
| Ahmedabad | 3,003 | 3,125 |
| Bengaluru | 6,104 | 7,660 |
| NCR | 5,120 | 6,065 |
| Chennai | 4,887 | 3,180 |
| Hyderabad | 12,723 | 6,487 |
| Kolkata | 1,658 | 2,518 |
| MMR | 10,070 | 18,331 |
| Pune | 10,764 | 11,548 |
| Total | 54,329 | 58,914 |
Source: Real Insight: Residential Annual Roundup 2020
The festive season quarter, which happens to be the most crucial time for builders, in terms of sales, because of the traditional value attached to property purchases during the auspicious festivals of Navratri and Diwali, witnessed sales of 58,914 units across the eight cities. Even though it accounts for a 68% increase over the July-September period of 2020, an annual comparison of these numbers with the data for Q4 2019 shows a decline of 27%.
“All factors considered, the sector has shown remarkable tenacity in 2020, against unprecedented odds that have caused the economy to contract and impacted consumer spending. The fact that housing sales in India’s key markets have started to bounce back, in spite of the general gloom caused by the pandemic, shows the immense potential of the real estate sector, which employs the highest number of unskilled workers in the country. The sector’s performance seems particularly impressive, given that the pandemic has impacted the income-generating capacity of a large number of people. End-users and investors continue to feel confident about investing in real estate. Prices continued to remain stable and the overall outlook looks positive,” said Dhruv Agarwala, group CEO, Housing.com, Makaan.com and PropTiger.com.
Barring Ahmedabad, sales of houses increased across cities when compared to the preceding quarter. Housing units from the affordable category made up 48% of the overall sales numbers during the quarter-ended December 31, 2020. At 31% and 20%, respectively, Mumbai and Pune contributed the highest to the quarterly sales numbers, the report shows.
The report attributes the quarterly growth in sales numbers to the lucrative offers launched by the developer community, the interest rate reduction by the RBI and the stamp duty and circle rate cut by some states.
After the RBI lowered the repo rate to 4% through consecutive cuts, most Indian banks have brought their home loan interest rates to the sub-7% level. Maharashtra, Karnataka and Madhya Pradesh have also been prompt in lowering stamp duties on property registration, to provide an impetus to the residential sector in the aftermath of the pandemic, the report says.
For the full year of 2020, a total of 1,82,639 units were sold, showing a fall of 47% in comparison with the overall sales registered in 2019. This is also indicative of the long road towards recovery for the residential segment, in the aftermath of the virus spread that continues to be a concern, with India reaching the 10-million infections mark in December-end.
2BHK units remained the most-preferred configuration for both, buyers and developers, in Q4, with a 48% share in the total launches and a 45% share in total sales, closely followed by 3BHK units.
“While the trends point to a market recovery and positive news, given the imminent launch of a vaccine that will ease the pandemic concerns, our optimism should be cautious. Buyers continue to expect low home loan rates, extension of developer offers and prefer ready-to-move-in inventory than those under construction. We believe that the government should continue to support the sector, through moves such as lowering stamp duty, re-evaluating circle rates and increasing the tax deduction limit for interest on home loans, to ensure that the sector continues to revive. The sector is digitising at a rapid pace and more than 90% of potential home buyers have moved online, to shortlist properties to buy. We have seen a strong growth in online booking throughout 2020,” added Mani Rangarajan, Group COO, Housing.com, Makaan.com and PropTiger.com.
Inventory overhang increases amid slow sales velocity
Registering a 9% decline annually, the unsold housing stock in the eight cities stood at over 7.18 lakh units as on December 31, 2020. However, the average inventory overhang has increased to 47 months as of December 2020, as compared to 27 months in December 2019. Inventory overhang is the estimated time builders should take to sell off the existing unsold stock, at the current sales velocity.
At 55% combined, while Mumbai and Pune continue to hold the highest share in the unsold stock, the inventory overhang is the highest in the NCR at 72 months. On the other hand, Hyderabad has the lowest inventory overhang of 29 months.
Mumbai had an unsold stock of 2.64 lakh units as on December 31, 2020, claiming a 37% share in the national inventory. Also, nearly 14% of this unsold stock in Mumbai falls under the ready-to-move-in category.
At 48%, the affordable housing segment contributes the highest to the national unsold stock. Also, nearly 19% of the total unsold inventory falls in the ready-to-move-in category.
Unsold stock: City-wise break-up
| City | Unsold stock as on December 31, 2020 (units) | Inventory overhang (in months) |
| Ahmedabad | 38,069 | 38 |
| Bangalore | 71,133 | 36 |
| Chennai | 35,583 | 42 |
| Hyderabad | 39,234 | 29 |
| Kolkata | 30,060 | 40 |
| MMR | 2,67,398 | 58 |
| NCR | 1,06,560 | 72 |
| Pune | 1,29,199 | 40 |
| National average | 7,18,483 | 47 |
Source: Real Insight: Residential Annual Roundup 2020
Annual price growth in cities remains largely flat
Nationally, price growth for new projects remained flat, as people refrained from making big-ticket purchases due to the prevailing economic uncertainty. The average per sq ft price of new property in India stood at Rs 6,042, showing flat annual growth in Q4 2020, over the same quarter of the previous year.
Property values of newly launched projects in mega cities in the one-year period also largely remained flat in most cities covered in the analysis, as demand-side concerns made appreciation difficult. However, Ahmedabad and Hyderabad stood as exceptions, where the annual per sq ft values of new property increased by 7% and 5%, respectively.
Owing to increasing construction costs amid a labour shortage, supply constraints and liquidity issues, growth of average prices has been flat in the NCR and MMR markets, the country’s two strongest housing markets.
Price growth: City-wise break-up
| City | Average price as on December 31, 2020 (in Rs per sq ft) | Annual growth in % |
| Ahmedabad | 3,213 | 7 |
| Bengaluru | 5,342 | 2 |
| Chennai | 5,228 | 2 |
| Hyderabad | 5,602 | 5 |
| Kolkata | 4,202 | 2 |
| MMR | 9,448 | No change |
| NCR | 4,268 | No change |
| Pune | 5,077 | 4 |
| National average | 6,042 | No change |
Source: Real Insight: Residential Annual Roundup 2020
Sales and new launches improve in Q3 2020 but concerns remain: PropTiger report
Despite a quarterly increase in sales and new launches, both, demand and supply, are quite far from reaching their past levels, says a report by PropTiger
October 14, 2020: After hitting a record low level in terms of demand and supply, as the Coronavirus pandemic exacted its effect on the national economy during the April-June period of 2020, India’s residential real estate segment has seen some restoration of normalcy as the government started the phased unlocking of the system during the July-September (Q3) period of the calendar year 2020 (CY 2020). This is reflected in home sales and new launches during the quarter, according to Real Insight Q3 2020, a quarterly analysis of India’s eight prime residential markets by PropTiger.com.
According to the report, developers sold 35,132 units during the period between July and September 2020, an increase of 85% from the previous quarter. Playing an instrumental role in what seems like the signs of a slow recovery process, housing units in the sub-Rs 45-lakh price bracket (categorised as the affordable housing segment under income tax laws in India) made the biggest contribution to overall sales during the quarter, contributing 45%.
The eight markets covered in the analysis are Ahmedabad, Bengaluru, Chennai, Hyderabad, Kolkata, the Mumbai Metropolitan Region (MMR), the National Capital Region (NCR) and Pune.
A similar trend was visible in the supply side. Of the 19,865 new units launched during the three-month period, 43% were from the sub-Rs 45-lakh price bracket. New supply also saw a quarter-on-quarter increase of 58%.
“Green shoots are visible, pointing to the start of a recovery in residential real-estate, evidenced by the improvement in new launches and sales on a quarter-over-quarter basis. These are unprecedented times, which have made buyers aware of the important role that homes play in ensuring their well-being, as well as their physical and emotional security. This, together with the fact that real estate is a hard asset and the fact that home loan rates are near a 15-year low, have encouraged buyers to return to the market. In recent times, the government and the Reserve Bank have also taken steps, to enhance liquidity in the sector and encourage banks to extend home loans at cheaper rates. With several macro-economic indicators showing a positive trend in September, we may well be on the road to a more sustained recovery and the upcoming festival season will be critical, in determining the growth trajectory in the sector over the next 12 months,” said Dhruv Agarwala, group CEO, Housing.com, PropTiger.com and Makaan.com.
Click here to read the full report
Industry leaders are of a similar opinion. Airing similar views, HDFC CEO Keki Mistry, on October 11, 2020, said: “The worst is behind us and the recovery has been faster than expected. By the end of December, the economy would be at the pre-COVID levels for most sectors. The December quarter growth could be better than the growth in the December quarter last year,” Keki said at an online dialogue organised by the All India Management Association (AIMA).
While stating that housing was the biggest employing sector in the country after agriculture, the HDFC boss indicated that the benign interest rate regime, which could continue till the time normalcy is restored, would benefit home buyers, thereby, pushing demand.
Nevertheless, demand and supply are quite far from reaching their past levels. When compared to the July-September period of 2019, new supply has contracted by 66% while sales have contracted by 57%. This was not unexpected, as the local economy took a severe beating and the world’s biggest heath emergency caused infection numbers to increase at its peak level in India, during the three-month period covered in the analysis.
“The Indian economy fared much worse than the markets had estimated and registered one of its worst troughs in history. The economy registered a contraction of 23.9% in the first quarter of FY21, which led to various rating agencies sharply cutting their GDP forecasts for India for the current fiscal year. Barring agriculture and allied activities, all other sectors such as manufacturing, real estate, mining and industry went in the red,” the report says.
Unsold stock declines while inventory overhang increases
Owing to restrained supply and buyers’ willingness to invest in ready homes, the unsold stock in these markets declined by 12% year-on-year. The unsold stock in the eight residential markets stood at 7,23,060 units as on September 30, 2020, as against 8,23,773 homes on September 30, 2019. On a quarter-on-quarter basis too, unsold stock reduced by 2% in the September quarter, when compared to the preceding quarter.
However, there is huge variation in inventory overhang from the level seen last year, because of the Coronavirus-induced strain on demand caused by the economic uncertainty and weak consumer sentiment. As against 28 months last year, inventory overhang currently is 43 months. Inventory overhang is the estimated time period within which developers will be able to sell off the current stock at the present sales velocity.
The housing markets in the west region continued to have the highest share in the overall inventory stock. Put together, Mumbai and Pune contributed 56% to the national unsold stock, followed by NCR and Bengaluru, with 15% and 10%, respectively.
Property price growth in key cities remains flat
While end-user demand and controlled supply in the micro-markets of Ahmedabad and Hyderabad have firmed prices in these cities, other cities have seen almost negligible movement annually, in terms of average pricing during the three-month period ended September 30, 2020.
In Ahmedabad and Hyderabad, there has been an annual increase of 6% in prices, primarily due to supply-side constraints.
Weighted average property prices in the top 8 residential markets
| City | Average price as on September 2020 (in Rs per sq ft) | Percentage change over September 2019 |
| Ahmedabad | 3,151 | 6% |
| Bengaluru | 5,310 | 2% |
| Chennai | 5,240 | 2% |
| NCR | 4,232 | -1% |
| Hyderabad | 5,593 | 6% |
| Kolkata | 4,158 | 1% |
| MMR | 9,465 | 1% |
| Pune | 4,970 | 2% |
Source: Real Insight Q3 2020
Virtual demand back to pre-COVID-19 levels
Amid the gloomy outlook, the demand for homes reached its pre-COVID-19 level in September, the report says, citing data from its Virtual Residential Demand Index. The Virtual Residential Demand Index is a barometer for online consumer interest for buying residential properties within a given period.
The report also indicates that more people are using online platforms to make property purchases, since the government imposed phased lockdowns, to counter the effects of the virus in India, in March 2020.
“It is understood that although there had been a steady movement in virtual interest levels for residential spaces, since the start of the year, the upswing in traction on virtual platforms has become more distinct after the stringent countrywide clampdown since March 2020,” the report said, adding that the phased opening of the economy has also attracted fence-sitters to take advantage of the historic low interest rates and a supportive ecosystem, which have further aided the sector.
“Consumers continue to perceive real-estate as the most stable asset and a number of them are looking to upgrade their homes, as working from home is likely to continue. The government has also been supportive, by taking steps to make buying more attractive. While states such as Maharashtra have reduced stamp duty rates on property transactions, financial institutions have also brought home loan interest rates to the sub-7% level since the RBI brought the repo rate to 4%. On its part, the developer community is not only ensuring buyers are able to book their future homes using virtual tools but also offering festive discounts and easy payment plans. We are optimistic that sales during the festive season will be encouraging and will help drive further recovery in the sector,” says Mani Rangarajan, group COO, Housing.com, Makaan.com and PropTiger.com.
Other key highlights in Q3
2BHK the most preferred configuration: 2BHK homes remained the most preferred configuration for both, buyers and developers, in the September quarter, with 53% share in the total launches and 46% share in total sales.
West India has more than half the national inventory stock: At 56%, Mumbai and Pune hold the highest share in the national unsold stock.
Ready homes’ stock: Nearly 19% of the total 7.28 lakh unsold inventory falls in the ready-to-move-in category.
Outlook for real estate in a post-COVID-19 era
Despite the low interest rate regime, the demand for housing has yet to hit the expected level and this is likely to happen, only after a cure is found for the Coronavirus. “Although the RBI and the government of India have undertaken a slew of fiscal and monetary measures to revive the economy, its impact on the overall economic scenario is still in a wait-and-watch mode,” says the report.
While stating that limited sales will be driven by fence-sitting end-users, the report also adds that demand is expected to be slow but steady, in the wake of job insecurity and salary cuts across the blue- and white-collar workforce.
On property prices, the report predicts a status quo. “Trends suggest that prices will continue to move in the current range. However, discounts and bargains will be available on a case-to-case basis,” it says.
Launches and sales witness sharp fall in Q2 2020 amid COVID-19 pandemic: PropTiger report
Home sales in India’s eight prime residential markets declined by 79% year-on-year (yoy) in the April-June period of 2020, while project launches fell by 81% during Q2 2020, a PropTiger.com report shows
July 29, 2020: With the Coronavirus pandemic posing serious questions on the economic health of the country, housing sales in India’s eight prime residential markets saw a drastic decline during the April-June period of 2020, at a time when the government announced phased lockdowns, to counter the effects of the deadly virus. A quarterly analysis by PropTiger.com, also shows that unsold stock continues to be a problem for India’s developer community, in spite of a fall in launches in the past few quarters, primarily because demand refuses to get back to the normal level.
Sales and launches in India’s 8 mega markets
| Sales | 19,038 units | 79% YoY fall | 73% QoQ fall |
| Launches | 12,564 units | 81% YoY fall | 65% QoQ fall |
Data for April-June quarter
Source: Real Insight: Q2, 2020
Click here to read the full report
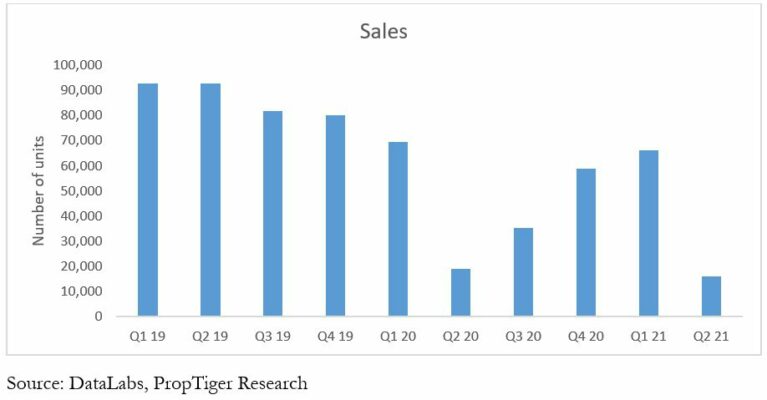
According to the quarterly analysis report titled Real Insight: Q2 2020, housing sales in the three-month period, which witnessed partial lifting of lockdowns in various parts of the country, dipped 79% over the same period last year. As against 92,764 units in the same period of 2019, only 19,038 units were sold during April-June this year. Affordable housing (units priced up to Rs 45 lakhs) continued to have a lion’s share in overall sales, claiming 44% of the share. Half the units sold during this period were concentrated in Mumbai and Pune.
During the period, real estate developers showed extreme caution with regard to new launches, amid rising liquidity concerns. New supply dipped 81% on a year-on-year basis, while declining 65% on a QoQ basis. In absolute terms, only 12,564 units were launched during this period across these eight markets. At 26%, Bengaluru contributed the highest to the overall supply numbers.
“The current pandemic is an unprecedented black swan event that is expected to contract growth in the global economy, including that of India. As anticipated, demand was adversely impacted due to the economic uncertainty, combined with growing unemployment. In fact, our recent Housing.com-NAREDCO buyer survey, indicated that buyers have pushed back their purchasing decision by up to a year. While developers are increasingly offering schemes, such as flexible payment plans, selective discounts and price protection plans, to attract buyers, they are also cautious and are focused on completing existing projects. The delivery of existing projects may get pushed back, depending on how quickly supply-chain, labour availability and liquidity inflows are restored. We are unlikely to see new launches increase significantly for the next few quarters, as developers wait for demand revival and augment their cash flows through sales of existing units. Notwithstanding these lacklustre results, buyers continue to affirm their faith in real estate as an asset class, with over a third of our surveyed buyers choosing it as their preferred form of investment,” says Mani Rangarajan, group COO, Housing.com, Makaan.com and PropTiger.com.
Inventory overhang now at 35 months
In spite of a 13% annual decline in unsold stock, the inventory overhang increased during Q2 2020, primarily because of demand-side concerns. While the eight markets have an unsold stock of 7,38,335 units now, as against 8,46,460 units in Q2 2019, the overhang is now at 35 months as against 28 months last year. Nearly 20% of the unsold inventory is from the ready-to-move-in category.
At 53 months, the inventory overhang is the highest in the NCR market. Overhang refers to the time builders are expected to take to sell off the existing stock, at the current sales velocity.
Inventory burden
| City | Inventory overhang (in months) |
| Ahmedabad | 26 |
| Bengaluru | 32 |
| Chennai | 36 |
| Hyderabad | 19 |
| Kolkata | 38 |
| MMR | 40 |
| NCR | 53 |
| Pune | 30 |
Data as on June 30, 2020
Source: Real Insight: Q2, 2020
Prices remain mostly unchanged
Barring Hyderabad and Ahmedabad, where property values increased by 7% and 6%, respectively, in the past one year, real estate rates remained largely unchanged in most other cities. The cost of property purchases, however, has come down, considering that the RBI has brought down the repo rate to 4%, following which banks have reduced their annual home loan interest rates to below 7%.
Price analysis
| City | Weighted average price (per sq ft) | Annual growth in Q2 2020 |
| Ahmedabad | Rs 3,104 | 6% |
| Bengaluru | Rs 5,299 | 3% |
| Chennai | Rs 5,138 | Flat |
| Hyderabad | Rs 5,505 | 7% |
| Kolkata | Rs 4,178 | 3% |
| MMR | Rs 9,490 | 1% |
| NCR | Rs 4,293 | 1% |
| Pune | Rs 4,951 | 2% |
Data as on June 30, 2020
Source: Real Insight: Q2, 2020
Note: Cities included in the analysis are Ahmedabad, Bengaluru, Chennai, Hyderabad, Kolkata, NCR, MMR and Pune.
Launches and sales fall in March quarter over Coronavirus fears: PropTiger report
Home sales in India’s nine prime residential markets declined by 26% year-on-year (yoy) in the January-March period of 2020, even as project launches continued their downward streak, falling 51% during Q4 FY20, a PropTiger.com report shows
April 24, 2020: Housing sales and new launches in India’s prime residential markets showed deceleration during the Q4 FY20 period, as the Coronavirus pandemic shattered all chances of any positive growth in the near term. According to a quarterly report of residential markets by PropTiger.com, sales and launches fell across cities during Q4 FY20, as the government was forced to announce a nationwide lockdown from March 25, 2020.
| Particulars | No of units in Q4 FY20 | Quarterly change | Yearly change |
| Launches | 35,668 | -27% | -51% |
| Sales | 69,235 | -11% | -26% |
| Inventory | 738,898 | -6% | -15% |
Source: Real Insight: Q4 FY20
According to the report, housing sales in India’s nine prime residential markets fell by 26% annually in Q4 FY20, while new launches declined 51% during this period. On a quarter-on-quarter basis, housing sales fell 11% while launches declined 27% in Q4 FY20, the report shows. A total of 69,235 units were sold during the quarter-ending March, as against 93,936 units sold during the same quarter of the last fiscal. Similarly, only 35,668 units were launched in Q4 FY20, as against 72,932 units in Q4 FY19. The nine markets covered in the analysis are Ahmedabad, Bengaluru, Chennai, Gurugram, Hyderabad, Kolkata, Mumbai, Pune and Noida.
Impact of Coronavirus on real estate
The report adds that housing sales and launches will continue to fall in the ongoing quarter (Q1 FY21), because of the Coronavirus outbreak and the subsequent lockdown. “Because of an unprecedented health emergency, India has imposed a 40-day lockdown till May 3, 2020, to stem the Coronavirus infections. The severe restriction on people’s movement, will adversely impact both, sales and launches, in Q1 FY21. Consequently, there might not be much relief for developers from the existing inventory burden,” it says.
“While the Chinese economy has been reeling under the Coronavirus contagion’s impact since December 2019, the situation in India started to get worrisome only towards March 2020. Following the spike in infections and severity of the situation, the government first announced a 21-day lockdown from March 25 and then, extended it till May 3. The lockdown, which has virtually brought to a standstill all economic activity in the country, has been detrimental to all sectors, including real estate. While there is no questioning the merit of the lockdown, its adverse impact is visible on housing sales and launches in Q4 FY20,” says Dhruv Agarwala, group CEO, Elara Technologies.
According to the report titled, Real Insight Q4 FY20, unsold stock in these markets declined by 15%, when compared to the same quarter last fiscal. Inventory overhang currently stands at 27 months.
At the end of March 2019, the nine markets had a combined unsold stock of 8,66,243 units. This has now reduced to 7,38,898 units. According to the report, Mumbai has the highest unsold stock, followed by Pune.
Unsold real estate inventory in India
| City | Inventory |
| Ahmedabad | 41,538 |
| Bengaluru | 75,001 |
| Chennai | 36,948 |
| Gurugram | 43,276 |
| Hyderabad | 31,118 |
| Kolkata | 33,966 |
| Mumbai | 2,78,229 |
| Noida | 59,041 |
| Pune | 1,38,781 |
| Total | 7,38,898 |
Source: Real Insight: Q4 FY20
“While the short-term negative impact of the pandemic on sales and launches cannot be negated, we expect the various support measures announced by the government and the RBI to yield positive results in the medium-term. Also, the lockdown is likely to bring about a major change in consumer behaviour, going forward. There already are early indications of this. While physical site visits to properties have stopped completely, online searches, as well as online bookings of apartments continue to take place. The adoption of digital platforms is likely to go up in the coming months. Much like mobile phone manufacturers that launch new products on a digital platform before a launch on traditional offline channels, we believe several real estate firms, particularly the reputed names, will adopt a similar strategy in the coming weeks and beyond,” Agarwala adds.
So far, no correction has been seen in property values, as rates continued to show upwards movement, even if only marginal. Barring Gurugram, prices showed upwards movement across markets in the past one year.
Property price trends in top cities
| City | Average rate per sq ft | Annual growth in % |
| Ahmedabad | Rs 3,032 | 6% |
| Bengaluru | Rs 5,275 | 3% |
| Chennai | Rs 5,184 | No change |
| Gurugram | Rs 4,893 | -1% |
| Hyderabad | Rs 5,434 | 9% |
| Kolkata | Rs 4,134 | 3% |
| Mumbai | Rs 9,472 | 2% |
| Noida | Rs 3,922 | 1% |
| Pune | Rs 5,017 | 4% |
Source: Real Insight: Q4 FY20
Housing sales fall 30% during festive season: PropTiger report
All hopes of an improvement in numbers during the festive season were dashed, with housing sales and project launches falling during the third quarter of the financial year 2019-2020, says a report by PropTiger.com
January 15, 2020: All hopes of an improvement in numbers during the festive season were dashed, with housing sales falling by 30% during the third quarter of the financial year 2019-2020 (Q3 FY20), a report by PropTiger.com shows. As against 91,464 units in the same quarter last year, only 64,034 homes were sold across India’s nine major residential markets, during the quarter ended December 2019, the report titled ‘Real Insight – Q3 FY20’ shows. Project launches also declined by 44% during the quarter year-on-year, amid a deepening crisis in the non-banking finance sector. Only 41,133 new units were launched during the quarter, says the report. Sales and launches fell across cities during the quarter.
“Several measures launched by the government in the past, to revive growth in the real estate market, seem to have made little impact. Considering that real estate is a major contributor to overall growth, which hit 4.5% in the July-September 2019 period, we expect further assistance from the government, to nudge buyers to invest in real estate. In the Union Budget scheduled on February 1, 2020, we expect finance minister Nirmala Sitharaman to announce measures that would result in higher savings for individual tax payers, thus, prompting them to invest in properties,” says Dhruv Agarwala, group CEO, Elara Technologies.
| Q3 FY19 (number of units) | Q3 FY20 (number of units) | Change (in percentage) | |
| Sales | 91,464 | 64,034 | -30 |
| Launches | 73,226 | 41,133 | -44 |
| Inventory | 8,83,483 | 7,74,860 | -12 |
Source: Real Insight – Q3 FY20
The unsold stock in the nine markets, however, reduced by 12% when compared to the level seen in the same quarter last year. Builders are now sitting on unsold stock consisting of nearly 7.75 lakh units and would take nearly 2.5 years to sell it, at the current sales velocity.
However, there was no correction in property prices, with rates increasing the most in Hyderabad in a year. With a 13% annual increase, average property values in the city hit Rs 5,318 per sq ft during the October-December 2019 quarter. The consistent growth in prices has now made Hyderabad as expensive a real estate market, as Bengaluru or Chennai.
Average property prices in the top 9 cities
| City | Average value per sq ft (in Rs) |
| Ahmedabad | 2,974 |
| Bengaluru | 5,195 |
| Chennai | 5,221 |
| Gurugram | 5,236 |
| Hyderabad | 5,318 |
| Kolkata | 4,035 |
| Mumbai | 9,446 |
| Noida | 3,923 |
| Pune | 4,874 |
Source: Real Insight – Q3 FY20
Home sales decline by 25% in September quarter, launches fall by 45%: PropTiger report
Sales of residential real estate units in India’s top nine markets declined by 25% year-on-year, in the quarter-ended September 2019, while launches also fell by 45%, says a report by PropTiger.com
October 18, 2019: India’s real estate sector has struggled to shrug off a slowdown in the July-September 2019 quarter, with housing sales declining by 25% during the period. According to Real Insights, a quarterly analysis of India’s nine residential markets by PropTiger.com, new launches also fell by 45% during the second quarter of the current financial year (Q2 FY20), when compared to the corresponding period last year. While the report expects sales to improve in the upcoming quarter, because of the festive season, it indicates that project launches may continue to fall, as developers in India continue to be under tremendous stress on account of liquidity challenges.
“With the festive spirit kicking in, we expect home sales to improve in the October-December quarter, whereas, new launch numbers may continue to decline, amid stressed liquidity conditions,” says the report. “Record low-interest rates and intensified measures by the government to restore growth momentum, would come in handy for buyers, who are planning to materialise their property purchase plans this festive season,” says Dhruv Agarwala, group CEO, Elara Technologies.
Unsold inventory declines in Q2 FY20
In what seems like a relief of sorts for developers, inventory levels during the quarter declined by 13% year-on-year. As of September 2019, builders in India’s nine markets have an unsold stock of 7,78,627 units, shows the report. Inventory overhang, shows the report has also declined during the quarter to 28 months. Inventory overhang is the estimated time that is likely to be spent, in selling the existing unsold stock at the current sales velocity. So, a 28-month overhang means that developers with inventory stock in the country’s nine residential markets would take two years and four months, to sell their existing stock.
Property prices increase marginally
An ongoing demand slowdown notwithstanding, property values have witnessed a marginal appreciation in the past one year, shows the report. Except for Gurugram and Chennai, where prices corrected by 4% and 1% annually, respectively, values appreciated in all other cities. The upwards movement in Hyderabad real estate has continued, with prices increasing by 15% in the past one year, shows the report.
The report also indicates that over two lakh housing units were delivered in the first two quarters of this financial year, while more than four lakh new units will also be delivered in the remaining half of this financial year. Another, 4.52 lakh ready-to-move-in homes are expected to join the market by FY21.
Note:
The cities covered in the analysis are Ahmedabad, Bengaluru, Chennai, Gurugram (includes Bhiwadi, Dharuhera and Sohna), Hyderabad, Kolkata, Mumbai (includes Navi Mumbai and Thane), Noida (includes Greater Noida and Yamuna Expressway) and Pune.
Affordable housing accounts for half of the unsold stock in key cities: PropTiger.com report
Units priced below Rs 45 lakhs, account for nearly half the unsold housing stock in India’s top nine cities, says a report by PropTiger.com
August 20, 2019: At a time when the government is busy launching measures to boost affordable housing in the country, homes sales and new launches in this category have declined. Units priced below Rs 45 lakhs account for nearly half the unsold stock in India’s nine key property markets, data available with PropTiger.com shows. Of the eight lakh units that have failed to find takers till June-end 2019, half were priced below Rs 45 lakhs.
Nevertheless, unsold inventory during the April-June 2019 quarter (Q1 FY20) declined by 12% year-on-year amidst a decline in new launches and comparatively better sales. While home sales in the affordable category fell 7% during the quarter ending June, new launches declined by 56%, when compared to the same quarter of 2018.
| City | Sales in the affordable housing segment | ||
| Q1 FY19 | Q1 FY20 | YoY change | |
| Ahmedabad | 3,666 | 3,577 | -2% |
| Bengaluru | 3,426 | 2,854 | -17% |
| Chennai | 2,078 | 2,301 | 11% |
| Gurugram | 2,087 | 3,319 | 59% |
| Hyderabad | 1,187 | 686 | -42% |
| Kolkata | 1,929 | 2,210 | 15% |
| Mumbai | 14,512 | 12,459 | -14% |
| Noida | 4,192 | 1,867 | -55% |
| Pune | 9,751 | 10,551 | 8% |
| Grand total | 42,828 | 39,824 | -7% |
| City | Launches in the affordable housing segment | ||
| Q1 FY19 | Q1 FY20 | YoY Change | |
| Ahmedabad | 5,403 | 259 | -95% |
| Bengaluru | 3,339 | 2,891 | -13% |
| Chennai | 2,340 | 1,723 | -26% |
| Gurugram | 1,202 | 3,626 | 202% |
| Hyderabad | 1,330 | 417 | -69% |
| Kolkata | 1,414 | 524 | -63% |
| Mumbai | 13,795 | 3,633 | -74% |
| Noida | 2,688 | 900 | -67% |
| Pune | 9,843 | 4,069 | -59% |
| Grand total | 41,354 | 18,042 | -56% |
Future trends: Sales may improve, while new launches will remain subdued
Some improvement in sales can be expected in the upcoming quarters, after the government increased the deduction limit on home loans meant for the affordable housing category. Buyers, who take a loan to buy a unit below Rs 45 lakhs, can now avail of deductions of up to Rs 3.5 lakhs in a year, on the interest component.
“A low interest rate regime, along with the measures announced in Budget 2019, to push affordable housing, would encourage home buyers to invest actively in this category now,” says Dhruv Agarwala, Group CEO, Elara Technologies. “New launch numbers, however, may not see much improvement, as developers are entirely focused on delivering their ongoing projects. With these two factors at work, housing inventory in India’s key property markets, will decline significantly in the following quarters,” he adds.
Cities with the largest stock of unsold affordable housing
According to data, Mumbai has the highest unsold inventory in the affordable housing category, with over 1.39 lakh units up for grabs. Following India’s financial capital is Pune, with over 98,000 unsold affordable units. Ahmedabad, Noida and Kolkata also have substantial inventory. Buyers looking for fresh and ready-to-move-in units, can explore these markets to find a budget property and also save on taxes.
| City | Unsold inventory of affordable housing | ||
| Q1 FY19 | Q1 FY20 | YoY change | |
| Ahmedabad | 45,751 | 41,791 | -9% |
| Bengaluru | 23,950 | 20,146 | -16% |
| Chennai | 15,570 | 18,709 | 20% |
| Gurugram | 22,203 | 22,307 | 0% |
| Hyderabad | 7,965 | 4,881 | -39% |
| Kolkata | 33,554 | 30,923 | -8% |
| Mumbai | 1,65,404 | 1,39,984 | -15% |
| Noida | 43,204 | 35,811 | -17% |
| Pune | 113,771 | 98,378 | -14% |
| Grand total | 471,372 | 412,930 | -12% |
New housing launches fall by 47%, while sales decline by 11% in Q1 FY20: PropTiger.com report
Home sales in India’s nine major property markets declined by 11% in Q1 of FY20, while new launches fell by 47%, as cash-starved developers waited for the outcome of the Lok Sabha elections before making any new plans, says a report by PropTiger.com
July 23, 2019: Home sales in India’s nine major property markets declined by 11% year-on-year in the first quarter (April-June) of the current financial year (FY20), according to a report by PropTiger.com. During the same period, new launches also fell by 47%, primarily because cash-starved developers waited for the outcome of the Lok Sabha elections, before making any new plans, the report titled ‘Real Insight‘ indicates. The only relief during the quarter, came in the form of a reduced housing stock, with unsold inventory declining 12% YoY.
The cities included in the analysis were Ahmedabad, Bengaluru, Chennai, Gurugram (includes Bhiwadi, Dharuhera and Sohna), Hyderabad, Kolkata, Mumbai (includes Navi Mumbai and Thane), Noida (includes Greater Noida and Yamuna Expressway) and Pune.
Launches: Gurugram defies the trend
As against 71,970 units in Q1 of FY19, only 37,852 housing units were launched in Q1 FY20, resulting in a fall of 47%. Barring Gurugram, where new launches more than doubled, from 2,588 units to 5,945 units, new launches fell across cities during this period. “The severe liquidity crunch and harsh market conditions continue to drive realtors to keep their guard on and exercise extreme caution, with respect to new launches, in order to survive in a difficult environment,” said the report.
| City | Launches | ||
| Q1 FY19 | Q1 FY20 | YoY change | |
| Ahmedabad | 7,499 | 824 | -89% |
| Bengaluru | 8,750 | 5,169 | -41% |
| Chennai | 3,502 | 2,374 | -32% |
| Gurugram | 2,588 | 5,945 | 130% |
| Hyderabad | 5,499 | 2,416 | -56% |
| Kolkata | 2,846 | 2,004 | -30% |
| Mumbai | 22,761 | 8,757 | -62% |
| Noida | 3,820 | 1,835 | -52% |
| Pune | 14,705 | 8,528 | -42% |
| Grand total | 71,970 | 37,852 | -47% |
Sales: Some cities show pick-up
When compared to 80,628 units in Q1 FY19, only 71,957 units were sold in Q1 FY20, a fall of nearly 11%. Home sales, however, increased in some cities, including Gurugram, Hyderabad, Kolkata and Pune. The sharpest increase in sales was seen in the millennium city Gurugram, where 4,951 units were sold in Q1 FY20 as against 3,737 units in Q1 FY19 – an increase of 32%.
| City | Sales | ||
| Q1 FY19 | Q1 FY20 | YoY change | |
| Ahmedabad | 5,268 | 3,362 | -36% |
| Bengaluru | 10,219 | 8,431 | -17% |
| Chennai | 4,683 | 4,574 | -2% |
| Gurugram | 3,737 | 4,951 | 32% |
| Hyderabad | 5,665 | 6,204 | 10% |
| Kolkata | 3,156 | 3,481 | 10% |
| Mumbai | 26,222 | 22,652 | -14% |
| Noida | 7,425 | 3,304 | -56% |
| Pune | 14,253 | 14,998 | 5% |
| Grand total | 80,628 | 71,957 | -11% |
Sales may, however, see some improvement in the future.
“A stable government has taken charge at the centre, after the Lok Sabha elections. The new government has announced several measures in the Union Budget 2019-20 that would definitely trigger fresh activity in India’s real estate sector,” said Dhruv Agarwala, group CEO, Housing.com, PropTiger.com, Makaan.com and Fastfox.com. “The Budget has, for instance, offered relief to home buyers, by increasing the tax deduction limit on the home loan interest component to up to Rs 3.50 lakhs on affordable homes. Several banks have also lowered their interest rates, after the RBI reduced its repo rate. As a result of this, sales activity might see a pick-up in the upcoming quarters,” Agarwala added.
Inventory: Falling for the better
On account of an arrest in new launches, housing inventory declined by over 12% in the past one year. Real estate developers had an inventory stock of 7,97,623 units in Q1 FY20 as against 9,09,324 units in Q1 FY19. Inventory stock declined across cities during the quarter, data showed. The inventory overhang also reduced slightly to 30 months – at the current sales velocity, it would take developers less than three years to sell the existing housing stock. The report added that another 5,00,000 fresh units would join the market by March 2020.
| City | Unsold inventory | ||
| Q1 FY19 | Q1 FY20 | YoY change | |
| Ahmedabad | 64,563 | 60,521 | -6% |
| Bengaluru | 87,602 | 77,295 | -12% |
| Chennai | 37,878 | 37,109 | -2% |
| Gurugram | 47,449 | 46,426 | -2% |
| Hyderabad | 43,322 | 32,874 | -24% |
| Kolkata | 50,146 | 44,970 | -10% |
| Mumbai | 3,43,111 | 2,92,225 | -15% |
| Noida | 76,378 | 63,637 | -17% |
| Pune | 1,58,875 | 1,42,566 | -10% |
| Grand total | 9,09,324 | 7,97,623 | -12% |
Prices: Hyderabad shows significant positive growth
Rates of property in Hyderabad increased by 17% in the past one year, the report shows. In other cities, however, the growth was muted with rates moving upwards between two and three percentage points. Gurugram was the only city that saw some price correction in the past one year, with prices falling by 3%.
FAQs
Which city has the lowest property rates?
Among the top eight cities, Ahmedabad had the lowest property rates in Q1 2022 at Rs 3,500-3,700 per sq ft.
Which city has the highest inventory overhang?
The Delhi National Capital Region had the highest inventory overhang in Q1 2022 at 73 months.
What is unsold inventory?
Unsold inventory in housing is the stock for which a builder has yet to find takers. This unsold stock is known as housing inventory.
What is inventory overhang?
Inventory overhang is the time builders in a particular market would take to sell off the unsold stock lying with them. This timeline is predicted factoring in the existing sales velocity in that market. If a builder would take, say, 25 months to sell his unsold stock after doing all the above mentioned calculation, his stock has an inventory overhang of 25 months.

An alumna of the Indian Institute of Mass Communication, Dhenkanal, Sunita Mishra brings over 16 years of expertise to the fields of legal matters, financial insights, and property market trends. Recognised for her ability to elucidate complex topics, her articles serve as a go-to resource for home buyers navigating intricate subjects. Through her extensive career, she has been associated with esteemed organisations like the Financial Express, Hindustan Times, Network18, All India Radio, and Business Standard.
In addition to her professional accomplishments, Sunita holds an MA degree in Sanskrit, with a specialisation in Indian Philosophy, from Delhi University. Outside of her work schedule, she likes to unwind by practising Yoga, and pursues her passion for travel.
[email protected]
Related Posts

Affordable housing keeping Indian real estate afloat: PropTiger.com report.

Online property search in September 2021 surpassed its historic peak, shows Housing.com’s IRIS index.

52 per cent of MahaRERA-registered residential stock unsold in Mumbai: Cushman & Wakefield and Propstack report.

New housing launches increase by 50 per cent in Q2 2018.

Adani Group forays into Pune, with luxury residential project.

PE inflows in residential realty at 4-year low, commercial at 4-year high: Report.