
In their latest report, real estate consultants Knight Frank noted that, in July 2025, over 4,662 residential property sales were registered in the Kolkata Metropolitan Region (KMA) in July 2025, reflecting a 33% year-on-year (YoY) increase. Registrations also rose 9% month-on-month (MoM) compared to June 2025. The data encompasses transactions in both primary (fresh sale) and secondary (re-sale) markets for residential apartments during this period.
July Month Apartment Registrations Data – 2021 to 2025
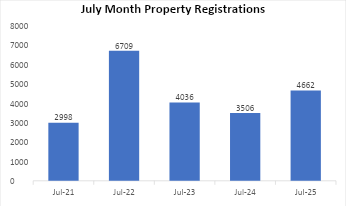
Source: Directorate of Registrations and Stamps Revenue, Government of West Bengal
*Includes apartment sales documents registered with flat/apartment sizes captured at the time of registration of the property
Apartment Size Analysis Comparison
| Year | Jan-Jul 2023 | Jan-Jul 2024 | Jan-Jul 2025 |
| Apartment Registered | 23,074 | 24,940 | 35,244 |
Source: Knight Frank India
Between January and July 2025, a total of 35,244 apartments were registered in the Kolkata Metropolitan Area, reflecting a 41% YoY increase compared to the same period last year. This sharp rise stands out against the nominal 3% YoY growth recorded in 2024, highlighting a significant surge in homebuyer appetite and the broader expansion of the residential market in the region.
Monthly Residential Sales Deeds Registered: June 2022 – July 2025
| Total Number of Residential Sales Deeds Registered* | In KMA | YoY trend | MoM trend |
| June 2022 | 3,044 | 114% | -28% |
| July 2022 | 6,709 | 124% | 120% |
| August 2022 | 6,238 | -15% | -7% |
| September 2022 | 5,819 | 20% | -7% |
| October 2022 | 6,788 | 45% | 17% |
| November | 3,047 | 167% | -55% |
| December | 3,274 | -17% | 7% |
| January 2023 | 4,178 | 75% | 28% |
| February 2023 | 2,922 | 83% | -30% |
| March 2023 | 3,370 | -28% | 15% |
| April 2023 | 2,268 | -31% | -33% |
| May 2023 | 2,863 | -32% | 26% |
| June 2023 | 3,437 | 13% | 20% |
| July 2023 | 4,036 | -40% | 17% |
| August 2023 | 3,605 | -42% | -11% |
| September 2023 | 4,347 | -25% | 21% |
| October 2023 | 4,441 | -35% | 2% |
| November 2023 | 3,656 | 20% | -18% |
| December 2023 | 3,737 | 14% | 2% |
| January 2024 | 1,184 | -72% | -68% |
| February 2024 | 4,806 | 64% | 306% |
| March 2024 | 3,936 | 17% | -18% |
| April 2024 | 3,839 | 69% | -2% |
| May 2024 | 3,377 | 18% | -12% |
| June 2024 | 4,292 | 25% | 27% |
| July 2024 | 3,506 | -13% | -18% |
| August 2024 | 5,410 | 50% | 54% |
| September 2024 | 4,979 | 15% | -8% |
| October 2024 | 4,004 | -10% | -20% |
| November 2024 | 4,680 | 28% | 17% |
| December 2024 | 5,720 | 53% | 22% |
| January 2025 | 5,134 | 334% | -10% |
| February 2025 | 5,016 | 4% | -2% |
| March 2025 | 5,609 | 43% | 12% |
| April 2025 | 5,080 | 32% | -9% |
| May 2025 | 5,483 | 62% | 8% |
| June 2025 | 4,260 | -1% | -22% |
| July 2025 | 4,662 | 33% | 9% |
Source: Directorate of Registrations and Stamps Revenue, Govt. of West Bengal
*Includes apartment sales documents registered with flat/apartment sizes captured at the time of registration of the property
Apartment Size Analysis Comparison
| Year | 0-500 sq ft | 501-1,000 sq ft | More than 1,000 sq ft |
| July 2023 | 1,086 | 2,053 | 897 |
| % of Monthly total | 27% | 51% | 22% |
| July 2024 | 1,592 | 1,646 | 268 |
| % of Monthly total | 45% | 47% | 8% |
| July 2025 | 2,496 | 1,960 | 206 |
| % of Monthly total | 54% | 42% | 4% |
Source: Knight Frank India
Apartments up to 500 sqft dominated Kolkata’s residential registrations in July 2025, accounting for 54% of all transactions, showing an improvement compared to 45% in July 2024 and a remarkable rise from 27% in July 2023. Interesting, this trend bucks the general affinity seen for larger homes in other comparable cities. However, the share of 500–1,000 sqft and over 1,000 sqft segments settled at 42% and 4%, respectively in July 2025 both showing a marginal decline from 47% and 8% in July 2024.
Shishir Baijal, chairman and managing director, Knight Frank India, stated, “Kolkata’s residential market recorded a robust 33% year-on-year growth in property registrations in July 2025, underscoring steady buyer confidence. Notably, apartments under 500 sqft accounted for 54% of total registrations, highlighting strong demand in this segment. This trend contrasts with most other markets across the country, where the shift has been towards larger homes. Infrastructure upgrades, enhanced connectivity, and the recent softening of interest rates are expected to further strengthen homebuyer sentiment particularly in the low to mid-value segments and help sustain this momentum through 2025.”
Micro-market share by Percentage
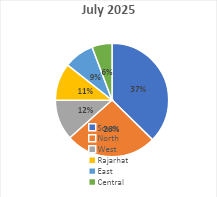
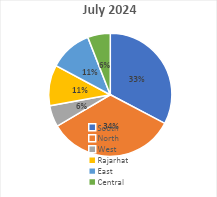
Source: Knight Frank India
In July 2025, the South Zone dominated the micro-market with an impressive 37% share of Kolkata’s total apartment registrations. Thakurpukur, Jadavpur, Behala and Kasba witnessed large volumes in terms of number of registrations within this zone. With many peripheral locations catering to affordable and mid-segment products, this zone’s share remained the highest among all the micro markets. However, the North Zone’s share came down from 34% in July 2024 to 26% in July 2025, though still maintaining the second rank in the city.
Top 10 locations – monthly sales deeds registered in July 2025
| Location | Number of Sales Deeds Registered |
| Rajarhat | 498 |
| Khardaha | 408 |
| Thakurpukur | 250 |
| Jadavpur | 218 |
| Behala | 215 |
| Kasba | 194 |
| Shibpur | 185 |
| Lake Town | 164 |
| Sonarpur | 127 |
| Titagarh | 113 |
| Total | 2,372 |
The top 10 locations comprised 51% of July 2025’s apartment registration volume in Kolkata.
| Got any questions or point of view on our article? We would love to hear from you. Write to our Editor-in-Chief Jhumur Ghosh at jhumur.ghosh1@housing.com |