
July 1, 2024: Mumbai recorded approximately 11,443 property registrations in June 2024, contributing over Rs 986 crore to the state exchequer, mentioned a Knight Frank report. Compared to the same period last year, property registrations have risen by 11% year-on-year (YoY), and revenues from these registrations have increased by 15% YoY, the report mentioned.
According to the Knight Frank report, strong buyer confidence in Mumbai has kept property sales above the 10,000 mark in the first half of the year. The market has seen consistent yearly growth in registrations for eleven months since August 2023. In June 2024, Mumbai experienced the highest number of property registrations for any June month in the past 12 years. This upsurge can be attributed to rising economic prosperity and a favourable sentiment towards homeownership.
Mumbai property sale registration and government revenue collection
| Period | Registration (Units) |
YoY | MoM | Revenue (INR cr) |
YoY | MoM |
| Jun-23 | 10,319 | 4% | 5% | 859 | 17% | 3% |
| Jul-23 | 10,221 | -10% | -1% | 831 | 0.3% | -3% |
| Aug-23 | 10,902 | 27% | 7% | 810 | 26% | -2% |
| Sep-23 | 10,694 | 24% | -2% | 1,127 | 54% | 39% |
| Oct-23 | 10,607 | 26% | -1% | 835 | 15% | -26% |
| Nov-23 | 9,736 | 9% | -8% | 712 | 4% | -15% |
| Dec-23 | 12,255 | 31% | 26% | 932 | 12% | 31% |
| Jan-24 | 10,967 | 22% | -11% | 760 | 10% | -19% |
| Feb-24 | 12,056 | 24% | 10% | 885 | -20% | 16% |
| Mar-24 | 14,149 | 8% | 17% | 1,123 | -8% | 27% |
| Apr-24 | 11,648 | 11% | -18% | 1,058 | 18% | -6% |
| May-24 | 12,000 | 22% | 3% | 1,034 | 24% | -2% |
| June-24 | 11,443 | 11% | -5% | 986 | 15% | -5% |
Source: Maharashtra Govt- Dept. of Registrations and Stamps (IGR)
Best June in last 12-years in terms of registration and stamp duty collection
| Month wise
Registration |
Sales registration | YoY
change |
Revenue
(INR cr) |
YoY
change |
| Jun-13 | 4,846 | NA | 254 | NA |
| Jun-14 | 4,812 | -1% | 272 | 7% |
| Jun-15 | 5,147 | 7% | 302 | 11% |
| Jun-16 | 5,334 | 4% | 312 | 3% |
| Jun-17 | 8,431 | 58% | 644 | 106% |
| Jun-18 | 6,183 | -27% | 430 | -33% |
| Jun-19 | 5,640 | -9% | 452 | 5% |
| Jun-20 | 1,839 | -67% | 153 | -66% |
| Jun-21 | 7,856 | 327% | 420 | 174% |
| Jun-22 | 9,919 | 26% | 734 | 75% |
| Jun-23 | 10,319 | 4% | 859 | 17% |
| Jun-24 | 11,443 | 11% | 986 | 15% |
Source: Maharashtra Govt- Dept. of Registrations and Stamps (IGR); Knight Frank India
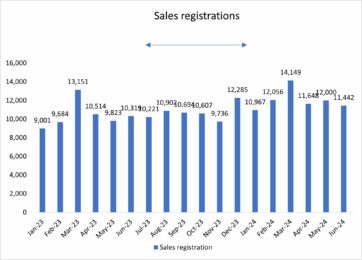
Average number of registrations in H1 2024 stood above 12-month average of 2023
Source: Maharashtra Govt- Dept. of Registrations and Stamps (IGR)
While property registrations in the city saw YoY growth in June, the average recorded registrations of 12,044 units in the first six months were notably higher than the twelve-month average of 10,578 units. This indicates the sustenance of Mumbai’s residential market strength and confidence of homebuyers.
Additionally, the average government revenue collection in the first six months of 2024, amounting to Rs 974 crore, were 8% higher than the average of Rs 906 crore witnessed in CY 2023. The rise in revenue can be credited to several contributing factors, such as the higher volume and value of properties being registered.
Shishir Baijal, chairman & managing director, Knight Frank India, said, “The continuous year-on-year growth in property sale registrations underscores the resilience of Mumbai’s real estate market. In the backdrop of higher property prices, home registrations have maintained their momentum, reflecting the market’s strong appetite and confidence buyers have in the country’s economic trajectory. This positive trend is expected to persist, driven by strong GDP growth, rising income levels, and a favourable interest rate environment, creating an encouraging atmosphere for potential buyers”.
Properties up to 1,000 sqft continue to lead in registrations
In June 2024, there was a noticeable increase in the registration of apartments measuring between 500 sqft and 1,000 sqft, accounting for 46% of all property registrations. In contrast, apartments measuring up to 500 sqft made up 36% of the registrations, down from 41% in June 2023. This indicates a clear inclination towards larger apartments, with the share of units up to 500 sqft witnessing a decline. Apartments measuring 1,000 sqft and above comprised 15% of the total registrations.
Area wise breakup of apartment sales
| Area (sq ft) | Share June 2023 | Share June 2024 |
| Up to 500 | 41% | 36% |
| 500 – 1,000 | 43% | 46% |
| 1,000 – 2,000 | 13% | 14% |
| over 2,000 | 3% | 4% |
Source: Maharashtra Govt- Dept. of Registrations and Stamps (IGR)
Western Suburb and Central Suburb account to 73% of the total market share
The share of western suburbs has fallen from 58% in June 2023 to 49% in June 2024 while Central Suburbs has recorded a jump in share as compared to June 2023 and has gone from 30% in June 2023 to 42% in June 2024. Central Mumbai saw a contribution of 2% while South Mumbai recorded a 1% rise to 7%.
Micro-Market wise breakup of apartment sales
| Micro-market | Share in June 2023 | Share in June 2024 |
| Central Mumbai | 6% | 2% |
| Central Suburbs | 30% | 42% |
| South Mumbai | 6% | 7% |
| Western Suburbs | 58% | 49% |
Source: Maharashtra Govt- Dept. of Registrations and Stamps (IGR)
| Got any questions or point of view on our article? We would love to hear from you. Write to our Editor-in-Chief Jhumur Ghosh at jhumur.ghosh1@housing.com |