February 28, 2024: The value of Prime International Residential Index (PIRI 100) has increased by 3.1% in 2023 showcasing solid overall gains, mentions the Wealth Report 2024, by Knight Frank. According to the report, of the 100 luxury residential markets tracked, 80 recorded positive to neutral annual price growth.
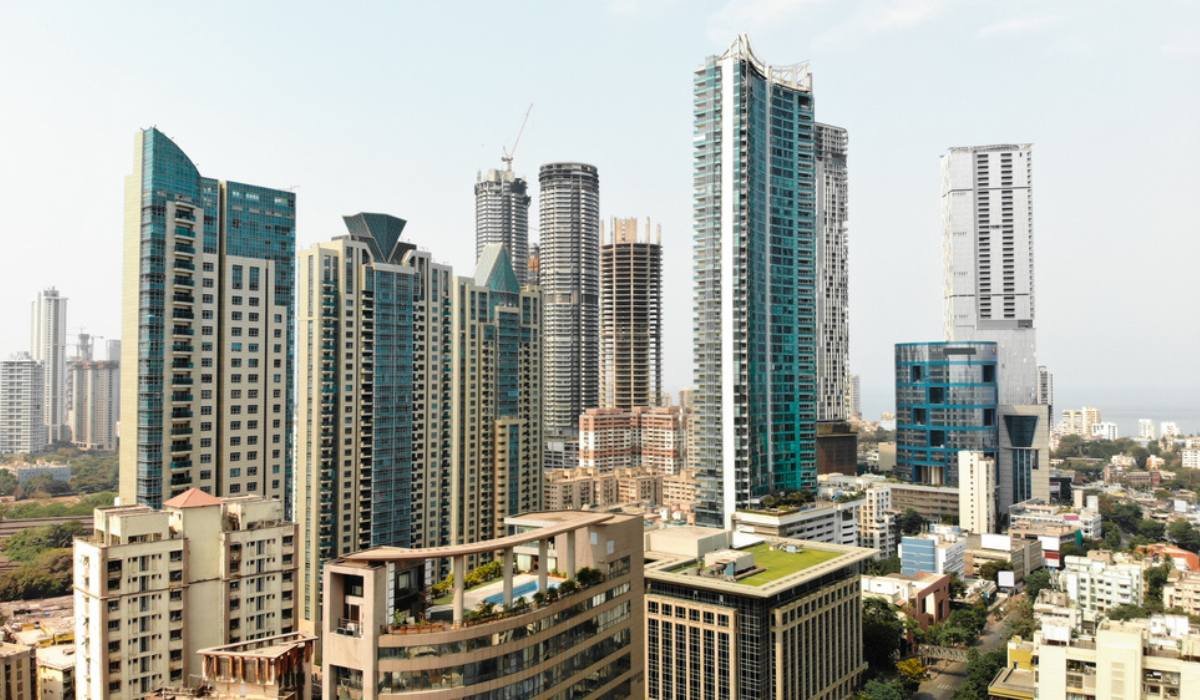
Competing with the world market, the report mentioned that Mumbai ranked 8th on Knight Frank’s PIRI’s index in 2023 as compared 37th rank in 2022 which is a phenomenal jump of 10% year on year (YoY) growth in terms of annual luxury residential price rise. This jump has marked a place for Mumbai in the top 10 leading luxury residential markets. Delhi ranked 37th and showcased rise of 4.2% YoY in 2023 as compared to 77th rank in 2022. Bengaluru stands at 59th rank compared to 63rd in 2022 recording a 2.2% YoY increase in 2023.
The report highlighted that Manila (26%) led the rankings while Dubai (16%), last year’s frontrunner slipped one spot. The Bahamas (15%) came in the third place with Algarve and Cape Town (both 12.3%) completed the top five.
Asia-Pacific (3.8%) pipped the Americas (3.6%) to the title of the strongest-performing world region, with Europe, the Middle East and Africa trailing (2.6%). The report mentioned that sun locations continued to outperform city and ski markets, up 4.7% on average. Ski resorts are close behind (3.3%) and prime prices in the city market tracked have risen 2.7% on average.
PIRI 100: Luxury residential markets’ performance, annual price change (2022 – 2023)
| No. | Location | Annual % change |
| 1 | Manila | 26.3 |
| 2 | Dubai | 15.9 |
| 3 | The Bahamas | 15.0 |
| 4 | Algarve | 12.3 |
| 5 | Cape Town | 12.3 |
| 6 | Athens | 12.0 |
| 7 | Ibiza | 12.0 |
| 8 | Mumbai | 10.0 |
| 9 | Shanghai | 8.6 |
| 10 | Mustique | 8.0 |
| 37 | Delhi | 4.2 |
| 59 | Bengaluru | 2.2 |
All price changes are in local currency
Source: Knight Frank – The Wealth Report 2023 (PIRI 100)
Kate Everett-Allen, head of international residential and country research at Knight Frank said, “At the start of 2023, economists were expecting a much weaker outcome across global residential property markets. Stock markets were heading for more pain, inflation was veering out of control and the pandemic-fuelled property boom was set to end in tears as borrowing costs hit 15-year highs in some markets. However, that never happened – we’ve seen a much softer landing in terms of price performance around the world.”
Shishir Baijal, chairman & managing director, Knight Frank India, said, “India’s luxury residential market has shown remarkable growth, as highlighted in Knight Frank’s Wealth Report 2024. Mumbai’s ascent to the 8th rank globally, with a staggering 10% year-on-year increase in luxury residential prices, underscores the city’s enduring appeal. While Mumbai logged into the top 10 league among PIRI 100 cities, Delhi and Bengaluru also demonstrated positive momentum by improving their ranks.
The outlook for 2024 remains bright as Mumbai with a 5.5% prime price growth forecast, ranks second among the 25 cities globally. As we navigate the complexities of the global market, India’s emergence as a prime destination for luxury real estate investment is undeniable.”
How much space can US $ 1 million buy?
| Cities | How much space US$1m buys in | |
| Places | Sq. Mt. | Sq. ft. |
| Monaco | 16 | 172.22 |
| Hong Kong | 22 | 236.80 |
| Singapore | 32 | 344.44 |
| London | 33 | 355.20 |
| Geneva | 34 | 365.97 |
| New York | 34 | 365.97 |
| Los Angeles | 38 | 409.02 |
| Paris | 40 | 430.55 |
| Shanghai | 42 | 452.08 |
| Sydney | 43 | 462.84 |
| Miami | 60 | 645.83 |
| Tokyo | 64 | 688.89 |
| Dubai | 91 | 979.51 |
| Madrid | 96 | 1033.34 |
| Mumbai | 103 | 1108.68 |
Source: Knight Frank Research
Monaco continues its reign as the world’s most expensive real estate market where $1 million can get you 16 sqm of space, followed by Hong Kong (22 sqm) and Singapore (32 sqm) in 2023. For $1 million, Mumbai offers for purchase 103 sqm of prime residential space, marking a reduction in space purchase of 8.85% YoY compared to 113 sqm in 2022. Comparatively in Delhi, one can purchase 217 sqm which accounts to reduction of 3.98% from 226 sqm in 2022. Bengaluru recorded a 2.12% space reduction from 385 sqm in 2022 to 377 sqm in 2023.
Area (in sqm) purchasable for $1 million over the last 5 years for Mumbai, Delhi and Bengaluru
| Cities | 2019 | 2020 | 2021 | 2022 | 2023 |
| Mumbai | 102 | 106 | 108.1 | 113 | 103 |
| Delhi | 197 | 202 | 206.1 | 226 | 217 |
| Bengaluru | 336 | 351 | 357.3 | 385 | 377 |
Source: Knight Frank Research
| Got any questions or point of view on our article? We would love to hear from you. Write to our Editor-in-Chief Jhumur Ghosh at [email protected] |

With 16+ years of experience in various sectors, of which more than ten years in real estate, Anuradha Ramamirtham excels in tracking property trends and simplifying housing-related topics such as Rera, housing lottery, etc. Her diverse background includes roles at Times Property, Tech Target India, Indiantelevision.com and ITNation. Anuradha holds a PG Diploma degree in Journalism from KC College and has done BSc (IT) from SIES. In her leisure time, she enjoys singing and travelling.
Email: [email protected]
Related Posts
India at rank 14 globally in annual home price movement in Q3 2023: Report.

Knight Frank Wealth Report shows that Indian UHNWIs still bet on property investment.

Is India’s luxury real estate market on the verge of a revival?.

How will Coronavirus impact the real estate market.

How to make your work from home more productive during times of Coronavirus.

Mumbai drives India BFSI leasing activity in 2022-H1 2023: Report.